The use of infographics gains more and more popularity nowadays. It’s believed to be a very efficient tool of delivering information and that people are more tend to pay attention to such a presentation of information than to a text article.
In this article, we’d like to consider what infographic is, the ways of its usage and, of course, provide you with the tips on how to make your own infographic design.
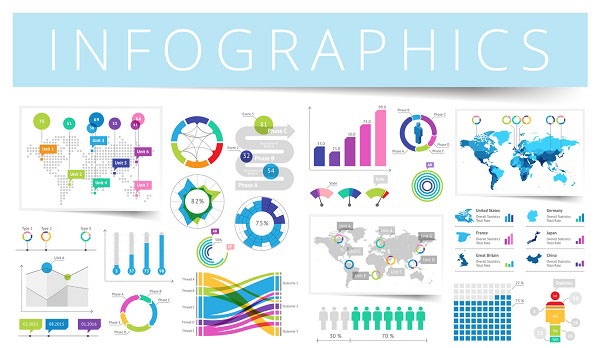
Infographic is a graphic representation of information, usually in the form of a chart, graph or image with the minimum amount of text. It usually serves to present the data in a more convenient way and make the understanding of the subject easier.
The key point in the creation of an inforgraphic is to make the information understandable at a glance. It’s made to deliver the message quickly and efficiently as well as make the presentation simpler.
As a rule, infographics consist of three parts: the visual, the content and the knowledge. The visual is the background and the images, which can either represent the information directly or be just connected with the theme. The content of each infographic is represented by facts and statistics while the knowledge is the insight into the data.
The Ways of Presenting the Information
Infographics can be presented in different ways. The most popular types of data visualization in such posters are time-series, statistical distribution, maps, hierarchies, network, informational, process and comparison infographics.
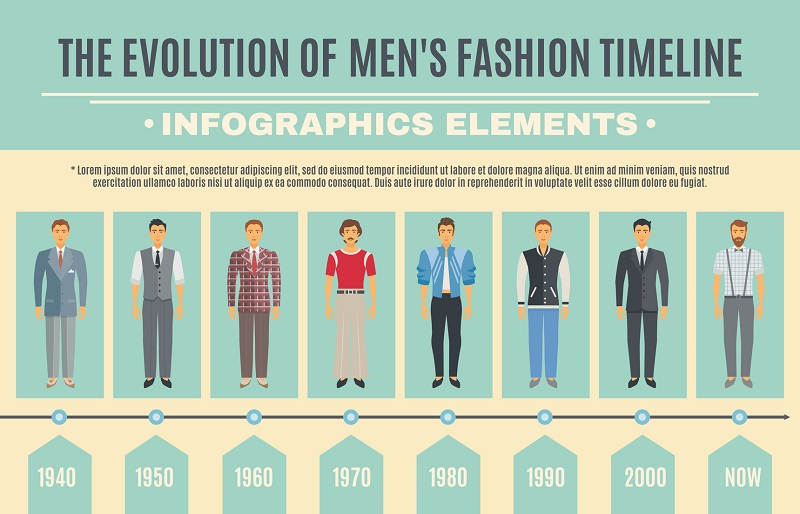
Time-series infographics represent all the information as a series of events or a series of values. They are great if you need to deliver the information of how something changed over the time or to present the information as a sequence or evolution.
A Men Fashion Evolution Infographic
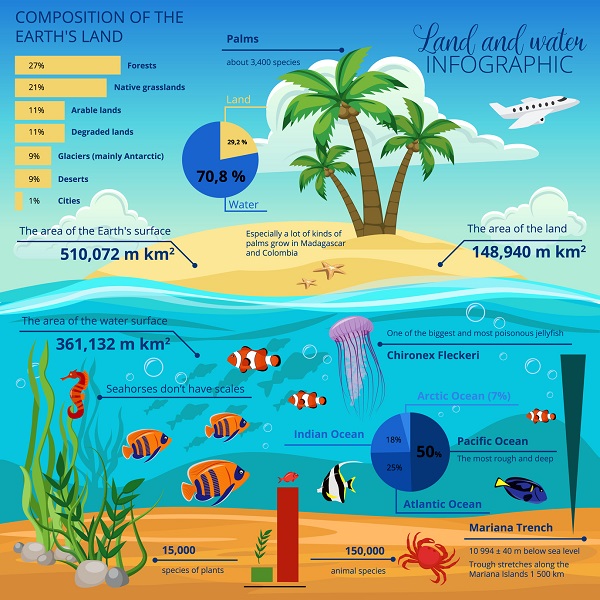
Statistical infographics deal with the distribution of numbers and are great if you want to tell a story with numbers. They are ideal for business reports, surveys and data driven stories.
A Statistical Land and Water Infographic
Maps are, as a rule, used for the presentation of geographical information, but there are many kinds of maps, which can be used for a great number of purposes. They suit you if you want to show distance and direction between different items or data points.
A World Religions Infographic Poster
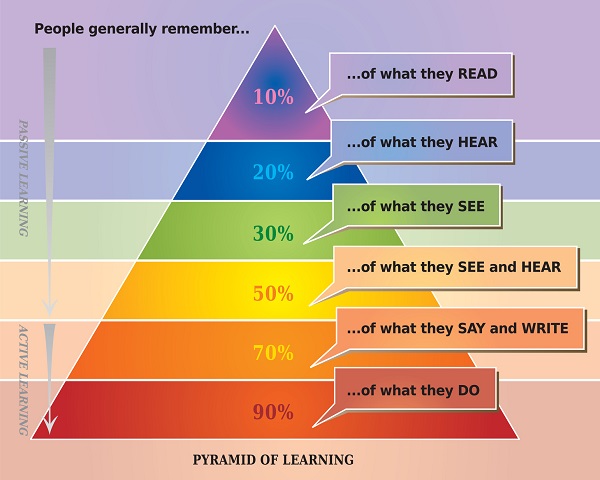
Hierarchies organize the information into different levels and show the connection between them. A pyramid chart is the most popular of hierarchy infographics.
A Pyramid of Learning Chart Poster
Network infographics deal with the representation of connection between certain objects and events.
A Healthy Lifestyle Network Infographic Poster
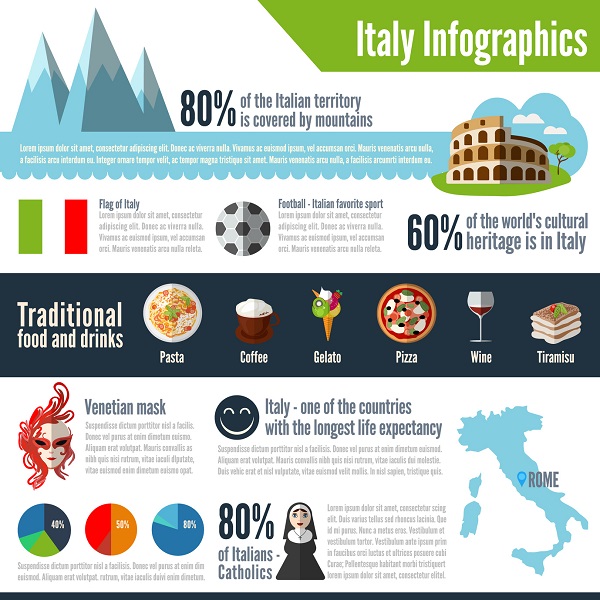
Informational infographics sum up the information and present it with the help of small informational pieces. They are usually used for informational posters, “listo-graphics”, presentations, brochures and instructional guides.
An Informational Infographic Poster about Italy
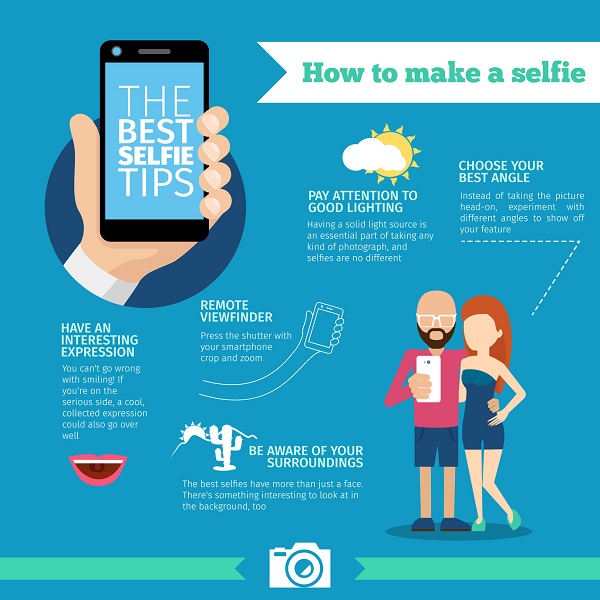
Process inforgraphic is used to show the process flow. It’s often used for the posters, which aim to show how to reach certain goals and how to do things.
A How to Make a Selfie Infographic
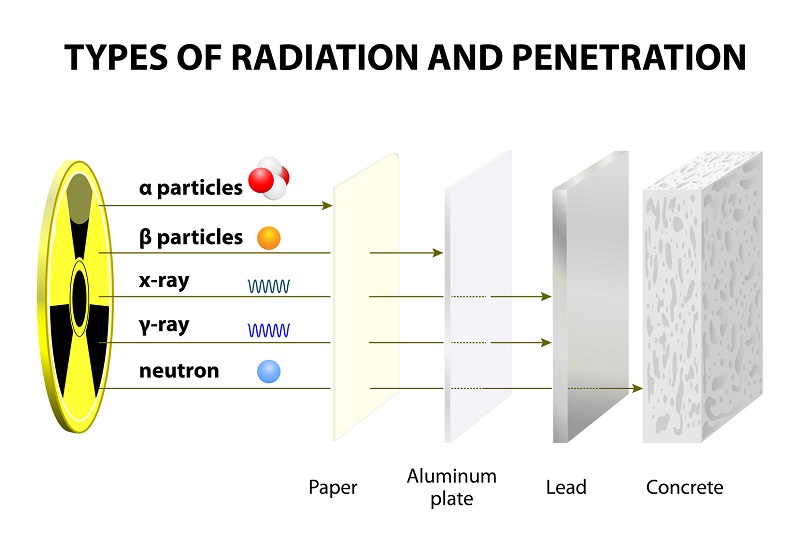
Comparison inforgraphic deals with comparing two or more things, showing their differences or similarities, the pros and cons. Such charts often help people to make choice between the things compared.
A Comparison of Types of Radiation Infographic Poster
The Use of an Infographic Poster
Infographics are used in many spheres of life. The most frequent spheres of their usage are business, science and education. Infographic posters are frequently used for business meetings, conferences as well as business trainings.
Educational posters often contain various infographics to deliver the information better and make the learning process easier. At the same time, science posters use infographics to present a huge amount of information in a short and spectacular form.
However, there are much more examples of how to use infographics in everyday life. For instance, it can be applied for the creation of traffic signs, weather charts, various kinds of maps etc. Moreover, the themes for such posters also vary: from the ones dedicated to the choice of a smartphone to safety instructions at a plant.
Tips on Making Infographic Posters
An Interesting Facts Infographic Poster
Though infographics are created to make the presentation of information easier, the process of their creation can be rather challenging. Here are some tips, which will help you to understand the process better and improve your skills in infographic design.
The Basic Steps for Infographic Creation
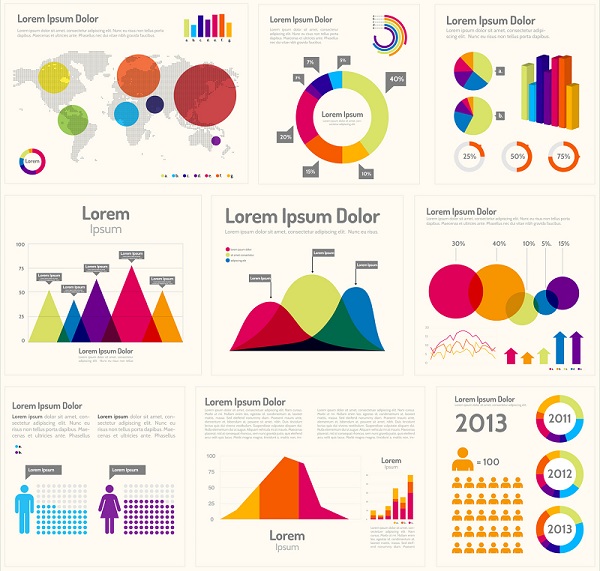
An Infographic Layouts Poster
The creation of all infographic posters implies several stages, which are similar for all prints regardless of the topic and sphere of usage. They are:
Select the topic. First of all, you need to make up your mind what your infographics will be about and what message you want to deliver. You should also clarify what your audience is and what it’s interested in. If you miss this stage, it’s possible that you can get lost somewhere in the middle of the process or that your poster will be not interesting to anyone.
Research. As you create inforgraphics not only to share the images but, first of all, to share the useful information, you need to make some research to find the necessary data. The information you provide needs to be really interesting to attract a greater number of viewers. Of course, this part of the project will take up much time, but it’s worth it.
First, think about the perspective of your infographic. Find out why this topic is of current interest and decide what exact aspect you want to show in your poster. Try to avoid boring facts and data and give preference to the facts, which will surprise the audience.
Later, look for the statistics and numbers. The statistics, which is visually presented, is perceived very easily. Moreover, there are many ways of how to present such a data. It’s also good if you not just present the information visually, but tell a story with it.
Choose the type of infographic. Now, it’s time to think how to present your data better. Depending on the theme and type of information, decide if the necessary data will be better presented with the help of timeline, statistical distribution, maps, hierarchies, networking, informational, process, comparison or any other type of infographics.
Thus, if you want to show the similarities and differences of certain objects, choose the side-by-side comparison infographic or, if you want to tell about certain historical events, pay attention to the timeline presentation and so on.
Find the necessary template and visuals. Once all the information is gathered, it’s time to think about visuals. The easiest way is to find an infographic template. There are many possible designs on the net and you just need to add your data to the ready template. Or, you can create the whole design from the very beginning.
You may think that only amateurs use infographic templates. However, even graphic designers make use of them or, at least, draw inspiration from them. If you are a creative personality, it wouldn’t be too difficult to turn a simple template into something original, using interesting data and images.
Create the design. Now, everything is ready for the creative process and you can start to combine the information and visuals to create the design of your infographic poster. You can do that, using computer programs, for example, PowerPoint. There are also a great number of online tools, which can help you to create a nice design (like Piktochart and Infogr.am).
Create the design. Now, everything is ready for the creative process and you can start to combine the information and visuals to create the design of your infographic poster. You can do that, using computer programs, for example, PowerPoint. There are also a great number of online tools, which can help you to create a nice design (like Piktochart and Infogr.am).
While choosing a color scheme for your infographic poster, take into account that the best option is to have about 5 colors present on the poster: three main colors and two accent ones. If you don’t know what colors are well-combined, you can use online tools and sites, which will help you in this issue.
As to the informative part of the poster, you need to draw the most important information from the data you have. There are certainly some pieces of the information, which are more important, and you need to highlight them in different sections. Once the key elements are found, add more details.
Check it. Of course, you need to check the design several times before having it printed. First of all, check the text for mistakes and misspellings. Later, you need to check if all the elements of the infographic look organic and the story flows smoothly.
And, of course, you need to have a look at the poster as a whole and make sure that text, pictures and other elements are harmonically interrelated.
The Secrets for a Better Infographic Design
A Business Improvement Infographic
Now, you know the basics of creation infographic posters and it’s time for you to know some secrets of how to make the posters look better and attract the attention of the viewers. There are some tips, which will help you to make a qualitative and attractive poster:
Don’t waffle. All the information must be on the topic. Even if you find some interesting facts, don’t include them into your infographic if they have nothing to do with the theme discussed.
Check the information. While doing the research, make sure that the data you have is from credible sources. Don’t use the facts, which aren’t proven, and don’t cite people, whose professionalism you doubt.
Fonts. Don’t use too many fonts. Try to have no more than 3 fonts. The text should be also written in one font type: either Sans Serif or Serif.
Layout. The infogragraphic poster should be well-balanced and easy-readable. That’s why after you choose the layout, stick to it. If you use images, it’s better if they are of the same style. In general, the design must be attractive but simple.
Show, don’t tell. The main plus of infographics is that they can present a huge amount of information in one piece of paper. Thus, your main aim is not to retell all the information you got, but present it visually.
Audience. While creating infographic posters for a certain group of people, you should constantly keep in mind who you are creating the poster for. Take into account your viewers’ background and interests.
Title. The title of the infographic is as important as an article title. That’s why, try to make it attractive and eye-catching.
We hope that our pieces of advice will be really helpful to you and you will have no problems in creating the infographic design you want. We believe that you will manage to create really cool posters, which will impress everyone by both their design and content.


Leave a Reply